Amazon Explore
Enabling seller growth through group experiences
My Role
Timeline
Context
Amazon Explore is an interactive livestreaming service that allows you to learn, shop and discover new places right from the comfort of your home.
My focus
When launched, all Explore live sessions were shared between a single host and a single customer(1:1). Group experiences(1:Many) will enable 1 host to lead up to 7 customers in a shared group session. Since a single session is shared between ‘many’ customers in this model, I expect the price of the session for each customer will be lower than in a 1:1 model. Lower prices are expected to drive customer growth and increase revenue for sellers.This was a large scale project with work across different areas of the Explore marketplace.
When launched, all Explore live sessions were shared between a single host and a single customer(1:1). Group experiences(1:Many) will enable 1 host to lead up to 7 customers in a shared group session. Since a single session is shared between ‘many’ customers in this model, I expect the price of the session for each customer will be lower than in a 1:1 model. Lower prices are expected to drive customer growth and increase revenue for sellers.This was a large scale project with work across different areas of the Explore marketplace.
Identified three primary problems with 1:1 experiences.
Results
Revisiting the success metrics
+6
4.7
Outcomes
Success metrics
-67%
+203
+38bps
86 NPS
Outcome
50K+
43%
~95M
1.2
Outcome for IES for Amazon
fill in metric
fill in metric
fill in metric
fill in metric
Success Criteria
1+
4.5
Defining Goals
50%
+150
+280bps
80nps
The Journey
2. In-Session Experience:
- Desktop (customer)
- App (host)
Final Designs
1. Detail Pages
IA Restructure
From our booking goals, and over 70% of our traffic coming from mobile devices, there was an opportunity for me to restructure the detail page information for content above the fold.

Areas of Ownership
Identified three primary problems with 1:1 experiences.
Explore Marketplace
This included the Explore storefront, search, filters and detail pages.
Pre-Session
Helping customers get ready for their livestream with a dedicated detail page.
In-Session
Entering into a livestream via mobile device browser from the detail page.
Post-Session
Storing customers photos and purchased items after their live session.
Problems
Identified three primary problems with 1:1 experiences.
Customer Survey
From a launch survey, 78% of customers would "love to experience this. with friends and family"
Price
Private experiences have also come at a premium price, making them too expensive for customers (62% of responses).
Seller Growth
The 1:1 nature of Explore has also restricted seller growth
Why?
1. Low Conversion on Mobile
Conversion on mobile was .56% compared to 1.71% on Desktop. A key reason is not being able to consume experiences on mobile devices.
2. Traffic
76%+ of all Explore traffic came from mobile (mWeb and mShop).
3. Post-session survey
58% of survey respondents indicated they would like to consume experiences on a mobile device.

Understanding the problem
1. LEARN
Find out how customers use and interact virtually
Seeing the both the issues and stresses related to virtual dating will help provide insight into problems and possible solutions.
2. DEFINE
Understanding target market
This will help find what motivates and frustrates users. By identifying the target market will help to better understand and deliver a tool to fill users needs.
3. DESIGN
Building a solution
From our findings we can start to evaluate and build a product to fill those needs.
4. TEST
Validating the designs
Determining the success of the tasks that will include defining certain metrics(KPIs).
The Problem(s)
Partner Satisfaction
In a survey participants favored Netflix (30%) and iTunes Connect (28%). We lag competitors in reporting, real-time publishing status, and self-service troubleshooting. YoY: portal tech capabilities (-6.6%), reporting (-6%), tech support (flat).
Disparate Partner Portals
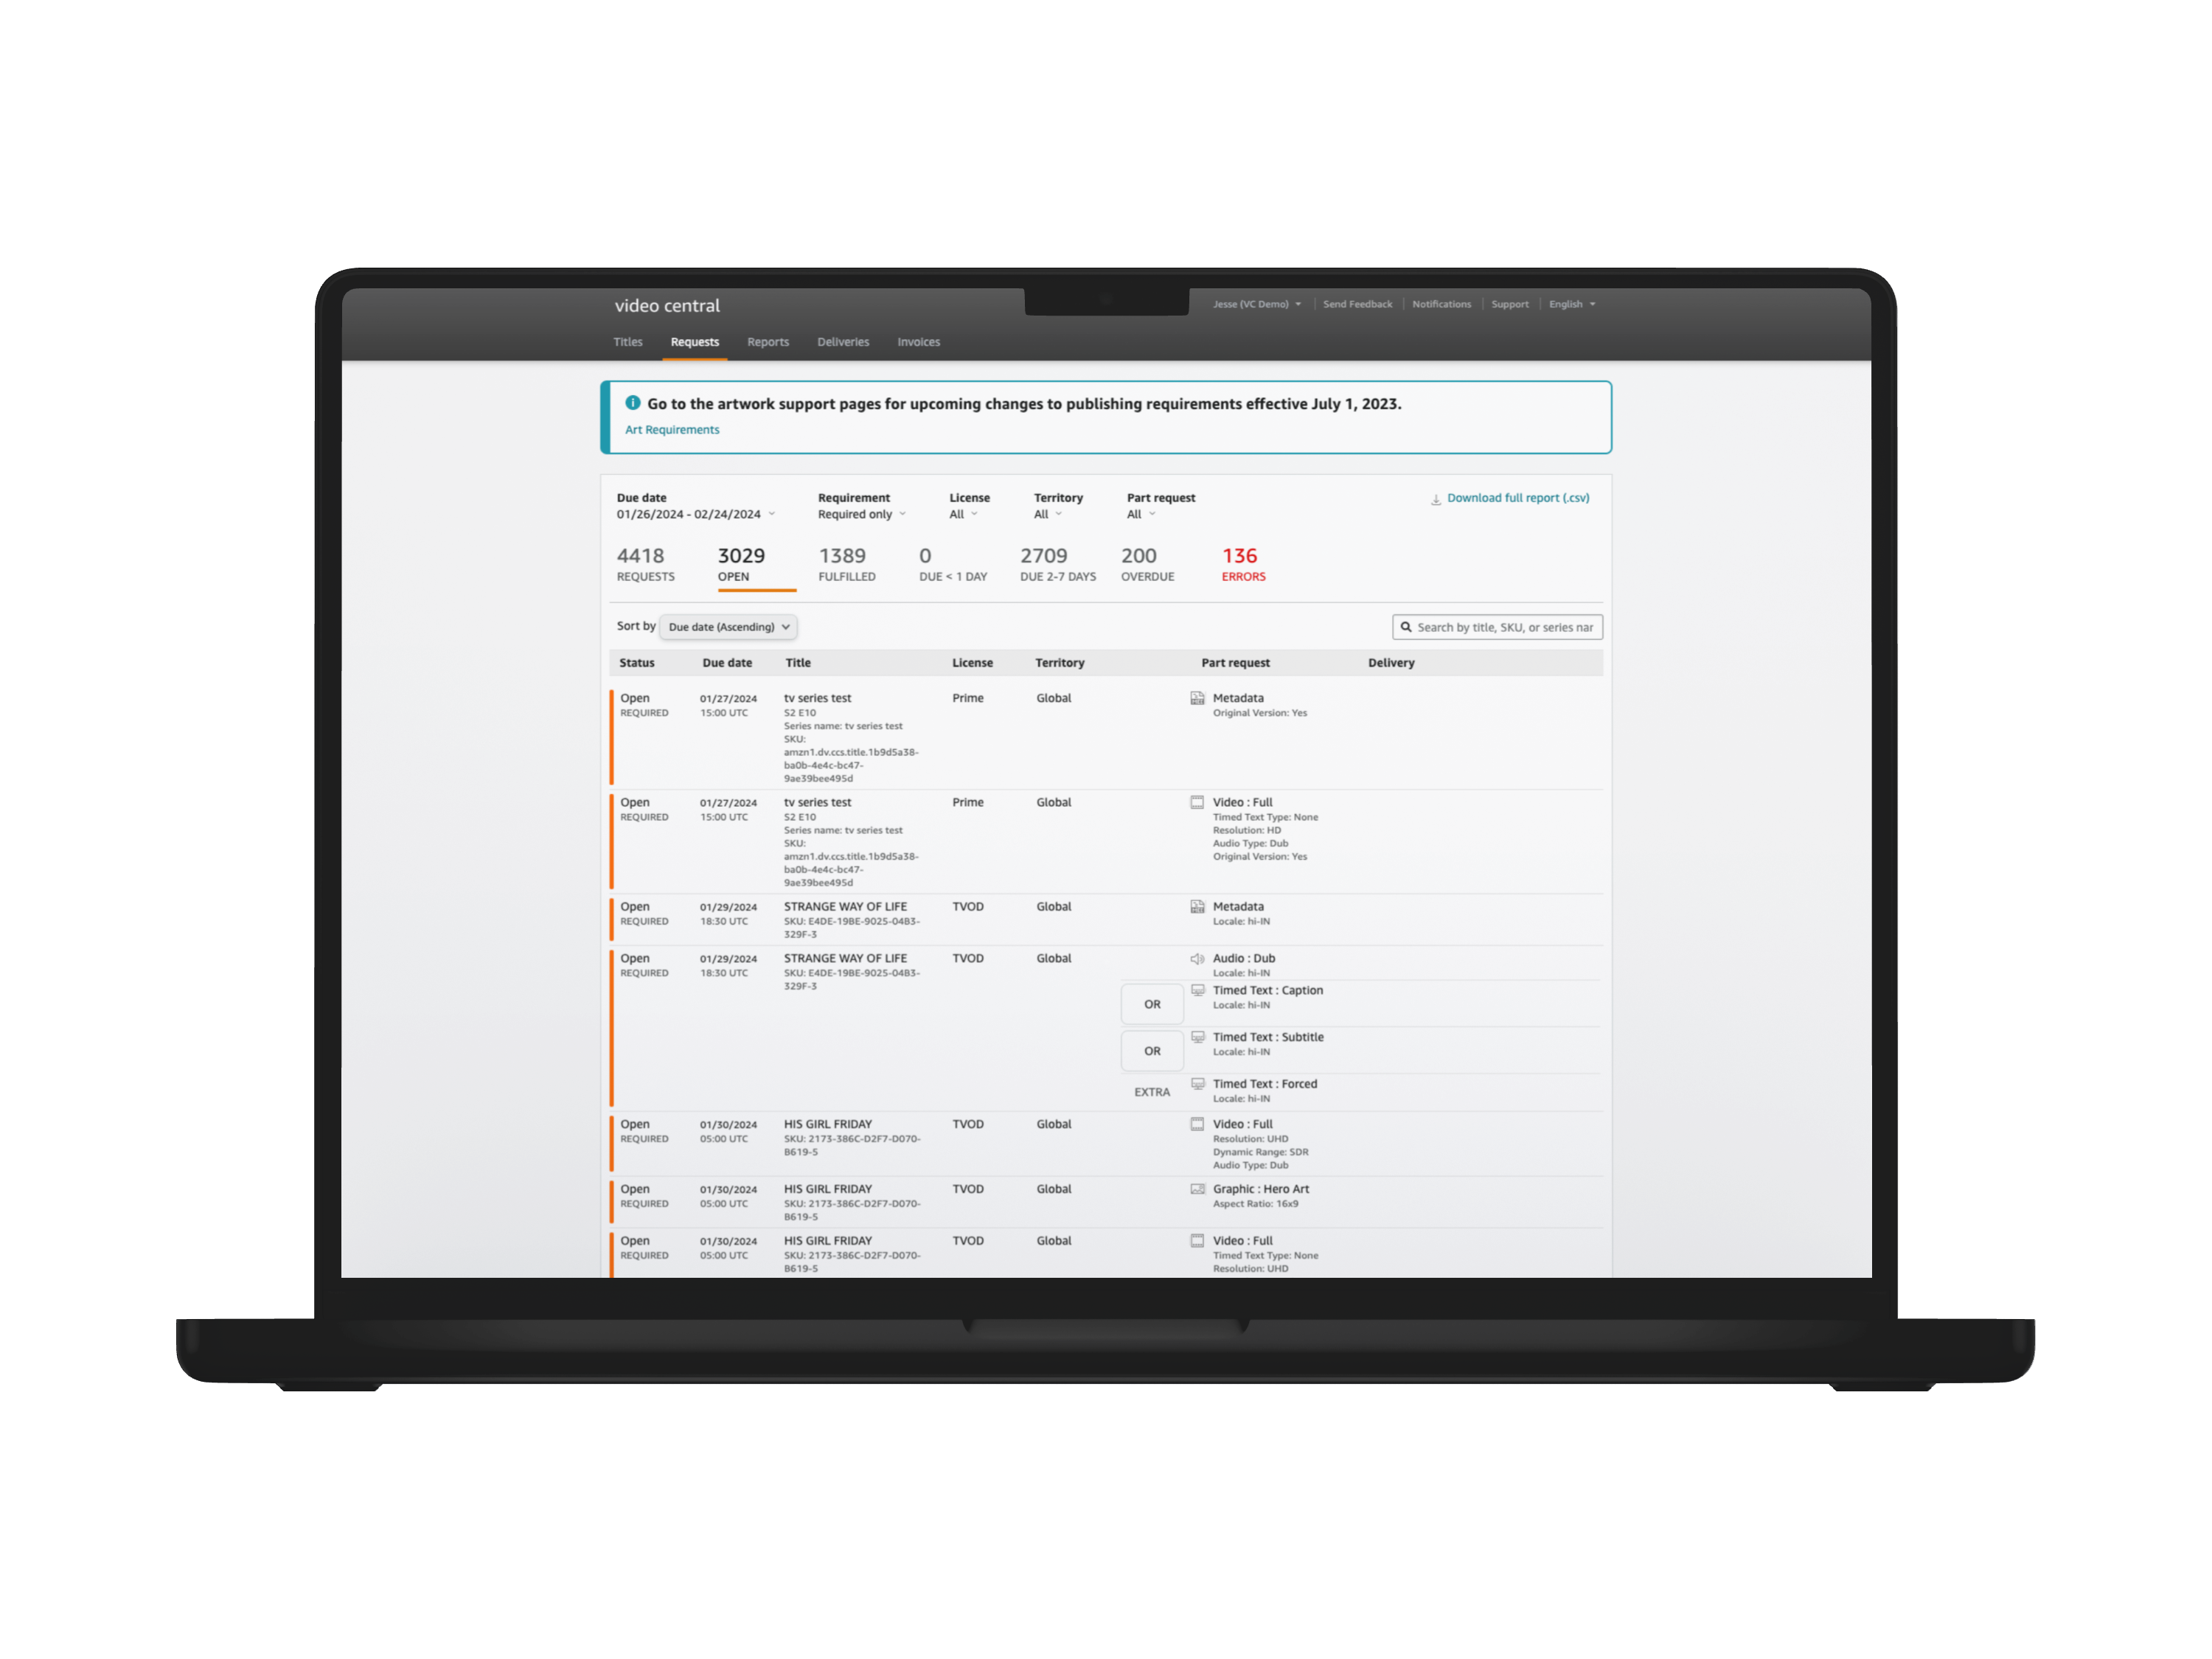
There exists limited feature parity between the two portals forcing VC partners to create and manage a separate PVD account to meet their business needs.
Over-Reliance on Operators
Managed partners primarily rely on Partner Operations Managers (POMs) to retrieve data on the health and publishing status of their PV catalog. A study survey indicated that 28.1% of POM’s time was spent on title level escalations
.png)

BuyX Design System
Worked with the BuyX design team and identified existing Amazon design pattern's for possible solutions.
Twister variations allowed for low tech debt, preexisting customer mental models and scalability. This, however, was not unique to the Explore service and added additional external dependencies.
Issues
Amazon App (mShop)
- Cannot launch an Explore experience directly from the Amazon App (mShop).
- Cannot link directly to outside browser or give direct content redirecting customer from browser to mShop (legal).
Supported Devices
- Operating Systems Supported - iOS & Android.
- Browsers Supported - Chrome and Safari.
- Tablet Models and Makes Supported (future).
Final Designs
These are the final designs that were shipped.


Wireframing
Went through different ideas and iterations for booking a group experience on detail pages.

Constraints
Fragmented Vision
Six-plus engineering teams with separate roadmaps and OKRs, and no single accountable thread for the new partner experience roadmap.
Misaligned Experiences
Two portals on separate tech stacks with different data sources running 5 different design systems. Partners and internal operators weren't seeing the same information.
Limited Visibility
Almost no insight into the competitor platforms partners were actively benchmarking us against.
Iterations
I prototyped three different directions, including the twister variation, and worked alongside marketing to test with internal customers with 50% preferring option 3.

Iterations
I prototyped three different directions, including the twister variation, and worked alongside marketing to test with internal customers with 50% preferring option 3.
Final Designs
These are the final designs that were shipped.

